
We analyzed over 200,000 TSA wait time records across seven major U.S. airports (ATL, DEN, DFW, EWR, HOU, IAH, and JFK) to measure the impact of the recent government shutdown.
Combined National Wait Times
Across all seven airports combined, the overall active wait times shifted upwards during the shutdown period:
- Average Minimum Wait: Increased from 6.70 mins to 7.95 mins (+18.75%)
- Average Maximum Wait: Increased from 7.10 mins to 8.21 mins (+15.60%)
Maximum Wait Time Spikes
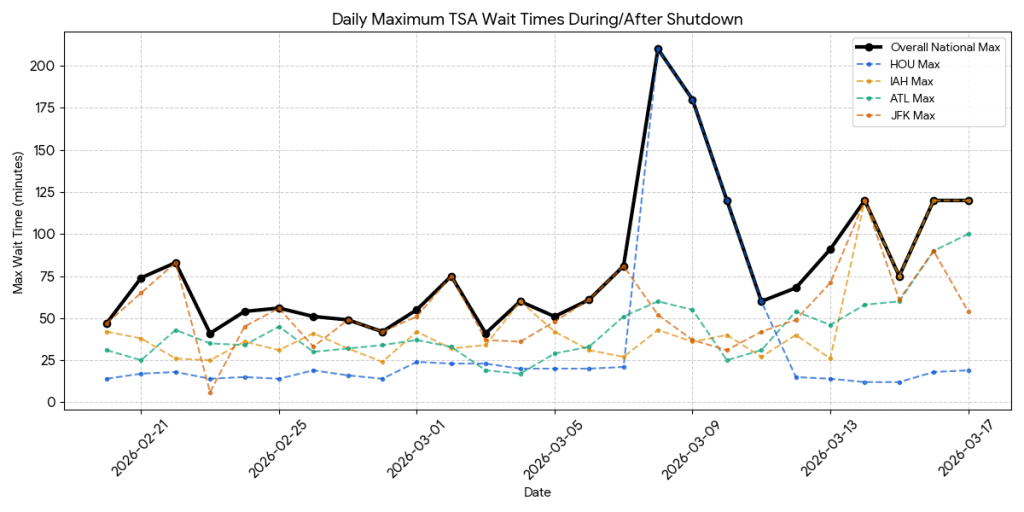
In addition to daily averages, tracking the absolute maximum wait times reveals how specific airports experienced severe bottlenecks that grew more frequent as the shutdown continued.
- The First Couple of Weeks: For the first 16 days of the shutdown, the system remained relatively stable. No airport recorded a wait time over 83 minutes.
- Late-Shutdown Spikes (March 8 – March 17): In the final 10 days of our dataset, three different airports recorded wait times of 100+ minutes on seven separate occasions.
- Houston Hobby (HOU): Before the shutdown, HOU’s highest recorded wait was 19 minutes. On March 8th, wait times peaked at 210 minutes (3.5 hours).
- Houston Bush (IAH) & Atlanta (ATL): IAH recorded 120-minute maximums on three separate days. Atlanta (ATL) saw its daily maximum wait time climb steadily throughout the month, ultimately hitting 100 minutes on March 17th.
Complete Airport-by-Airport Breakdown (peak wait time)
| Airport | Peak Before | Peak During | Impact |
| HOU | 19 mins | 210 mins | +191 mins |
| ATL | 43 mins | 100 mins | +57 mins |
| IAH | 41 mins | 120 mins | +79 mins |
| DFW | 65 mins | 91 mins | +26 mins |
| DEN | 35 mins | 35 mins | No Change |
| JFK | 224 mins | 120 mins | -104 mins |
| EWR | 120 mins | 120 mins | No Change |
Key Takeaways for Travelers
- Monitor Specific Airports: Wait times vary drastically by location. Unaffected hubs like JFK, EWR, and DFW absorbed the shutdown with almost zero impact to their standard wait times (for now).
- Prepare for Localized Delays: Heavily impacted airports like HOU, ATL, and IAH experienced significant baseline increases and isolated 100+ minute bottlenecks. If flying out of these locations, arriving earlier than usual is recommended.
- Check Real-Time Data: Because security line volume depends heavily on the departure location and time of day, checking real-time trends for your specific airport is more effective than relying on general, nationwide travel guidance.